Reports & Analytics overview
X0PA AI includes an extensive reporting suite so you can measure and improve your hiring. Open Reports in the top navigation bar to reach the reports hub.
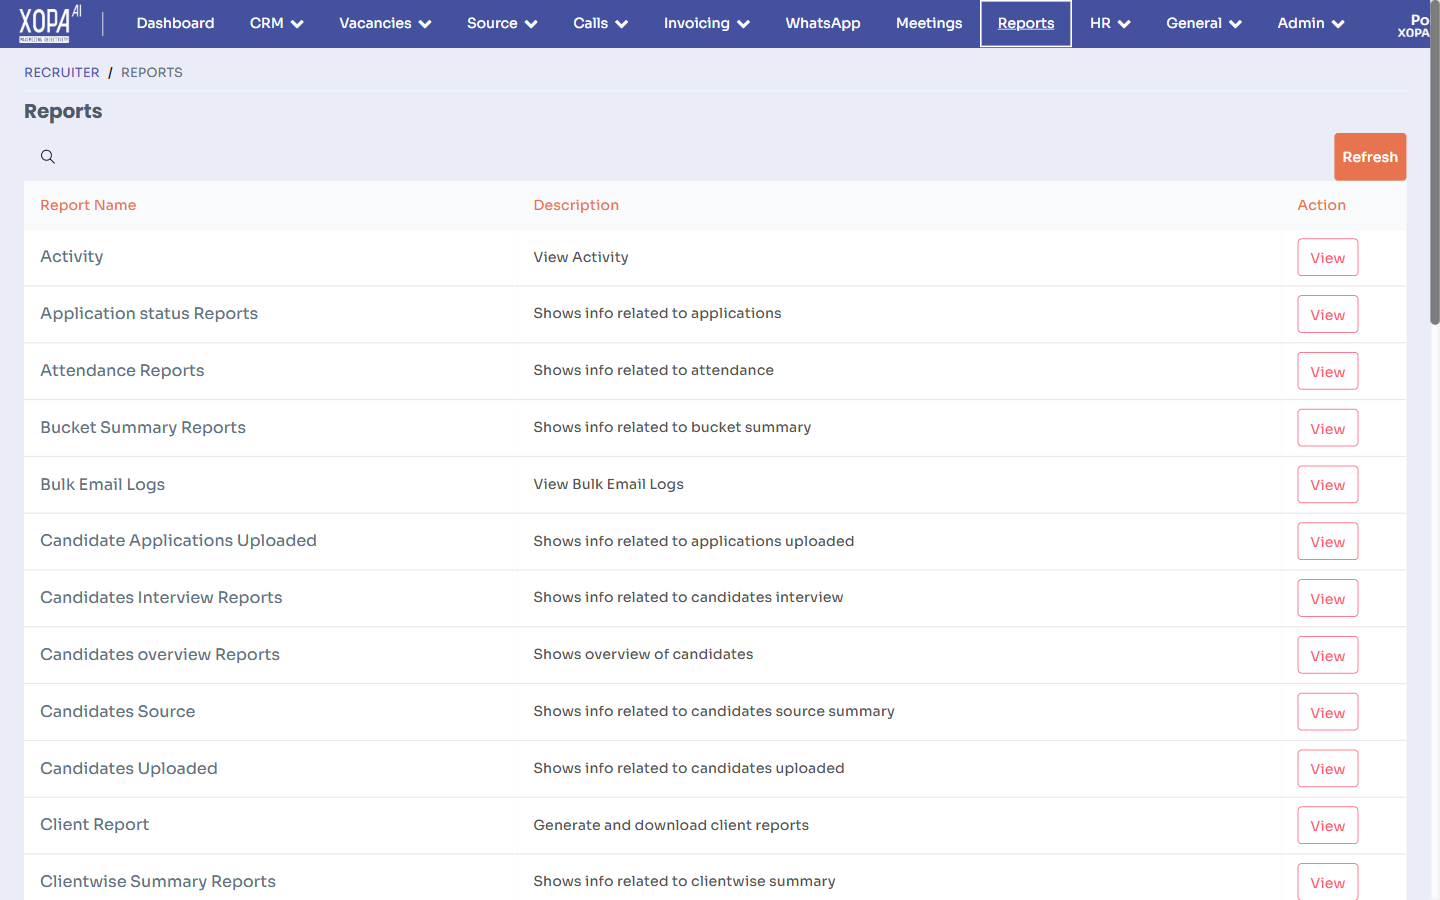
The Reports hub: a searchable list of reports (Activity, Application Status, Attendance, Candidates, Client, and many more), each with a View action.
Finding a report
The reports hub groups many reports by theme (pipeline, offers, interviews, joinees, revenue, recruiter performance, and more). To find one:
- Open Reports.
- Browse the categories or search by report name.
- Select a report to open it.
Running a report
Most reports share the same controls:
- Filters — date range, vacancy, recruiter, client/company, department, status, etc.
- Group by — summarise by recruiter, stage, source, or period.
- Refresh — apply your filters to update the results.
🖼️ Screenshot: A report with a filter bar across the top and a results table below.
Exporting
Most reports can be downloaded (for example to Excel/CSV) for sharing or further analysis. Look for the export/download control on the report.
:::tip Set a consistent date range When comparing reports (for example pipeline vs offers), use the same date range across them so the numbers line up. :::
Where to go next
- Common reports — the reports most teams use.
- Analytics — interactive dashboards.
Related
- Joinees — the data behind conversion reports.
- Understanding the hiring workflow — stages that drive pipeline reports.